
Central bank actions in September
• Fed: +25 bps to 3.75–4.00%, its first hike since 2023; 16 of 18 officials expect at least one more.
• ECB: +25 bps to 2.50%, with inflation projected at 3.0% this year.
• BoJ: +25 bps to 1.25%, the highest since 1995, on a split 7–2 vote.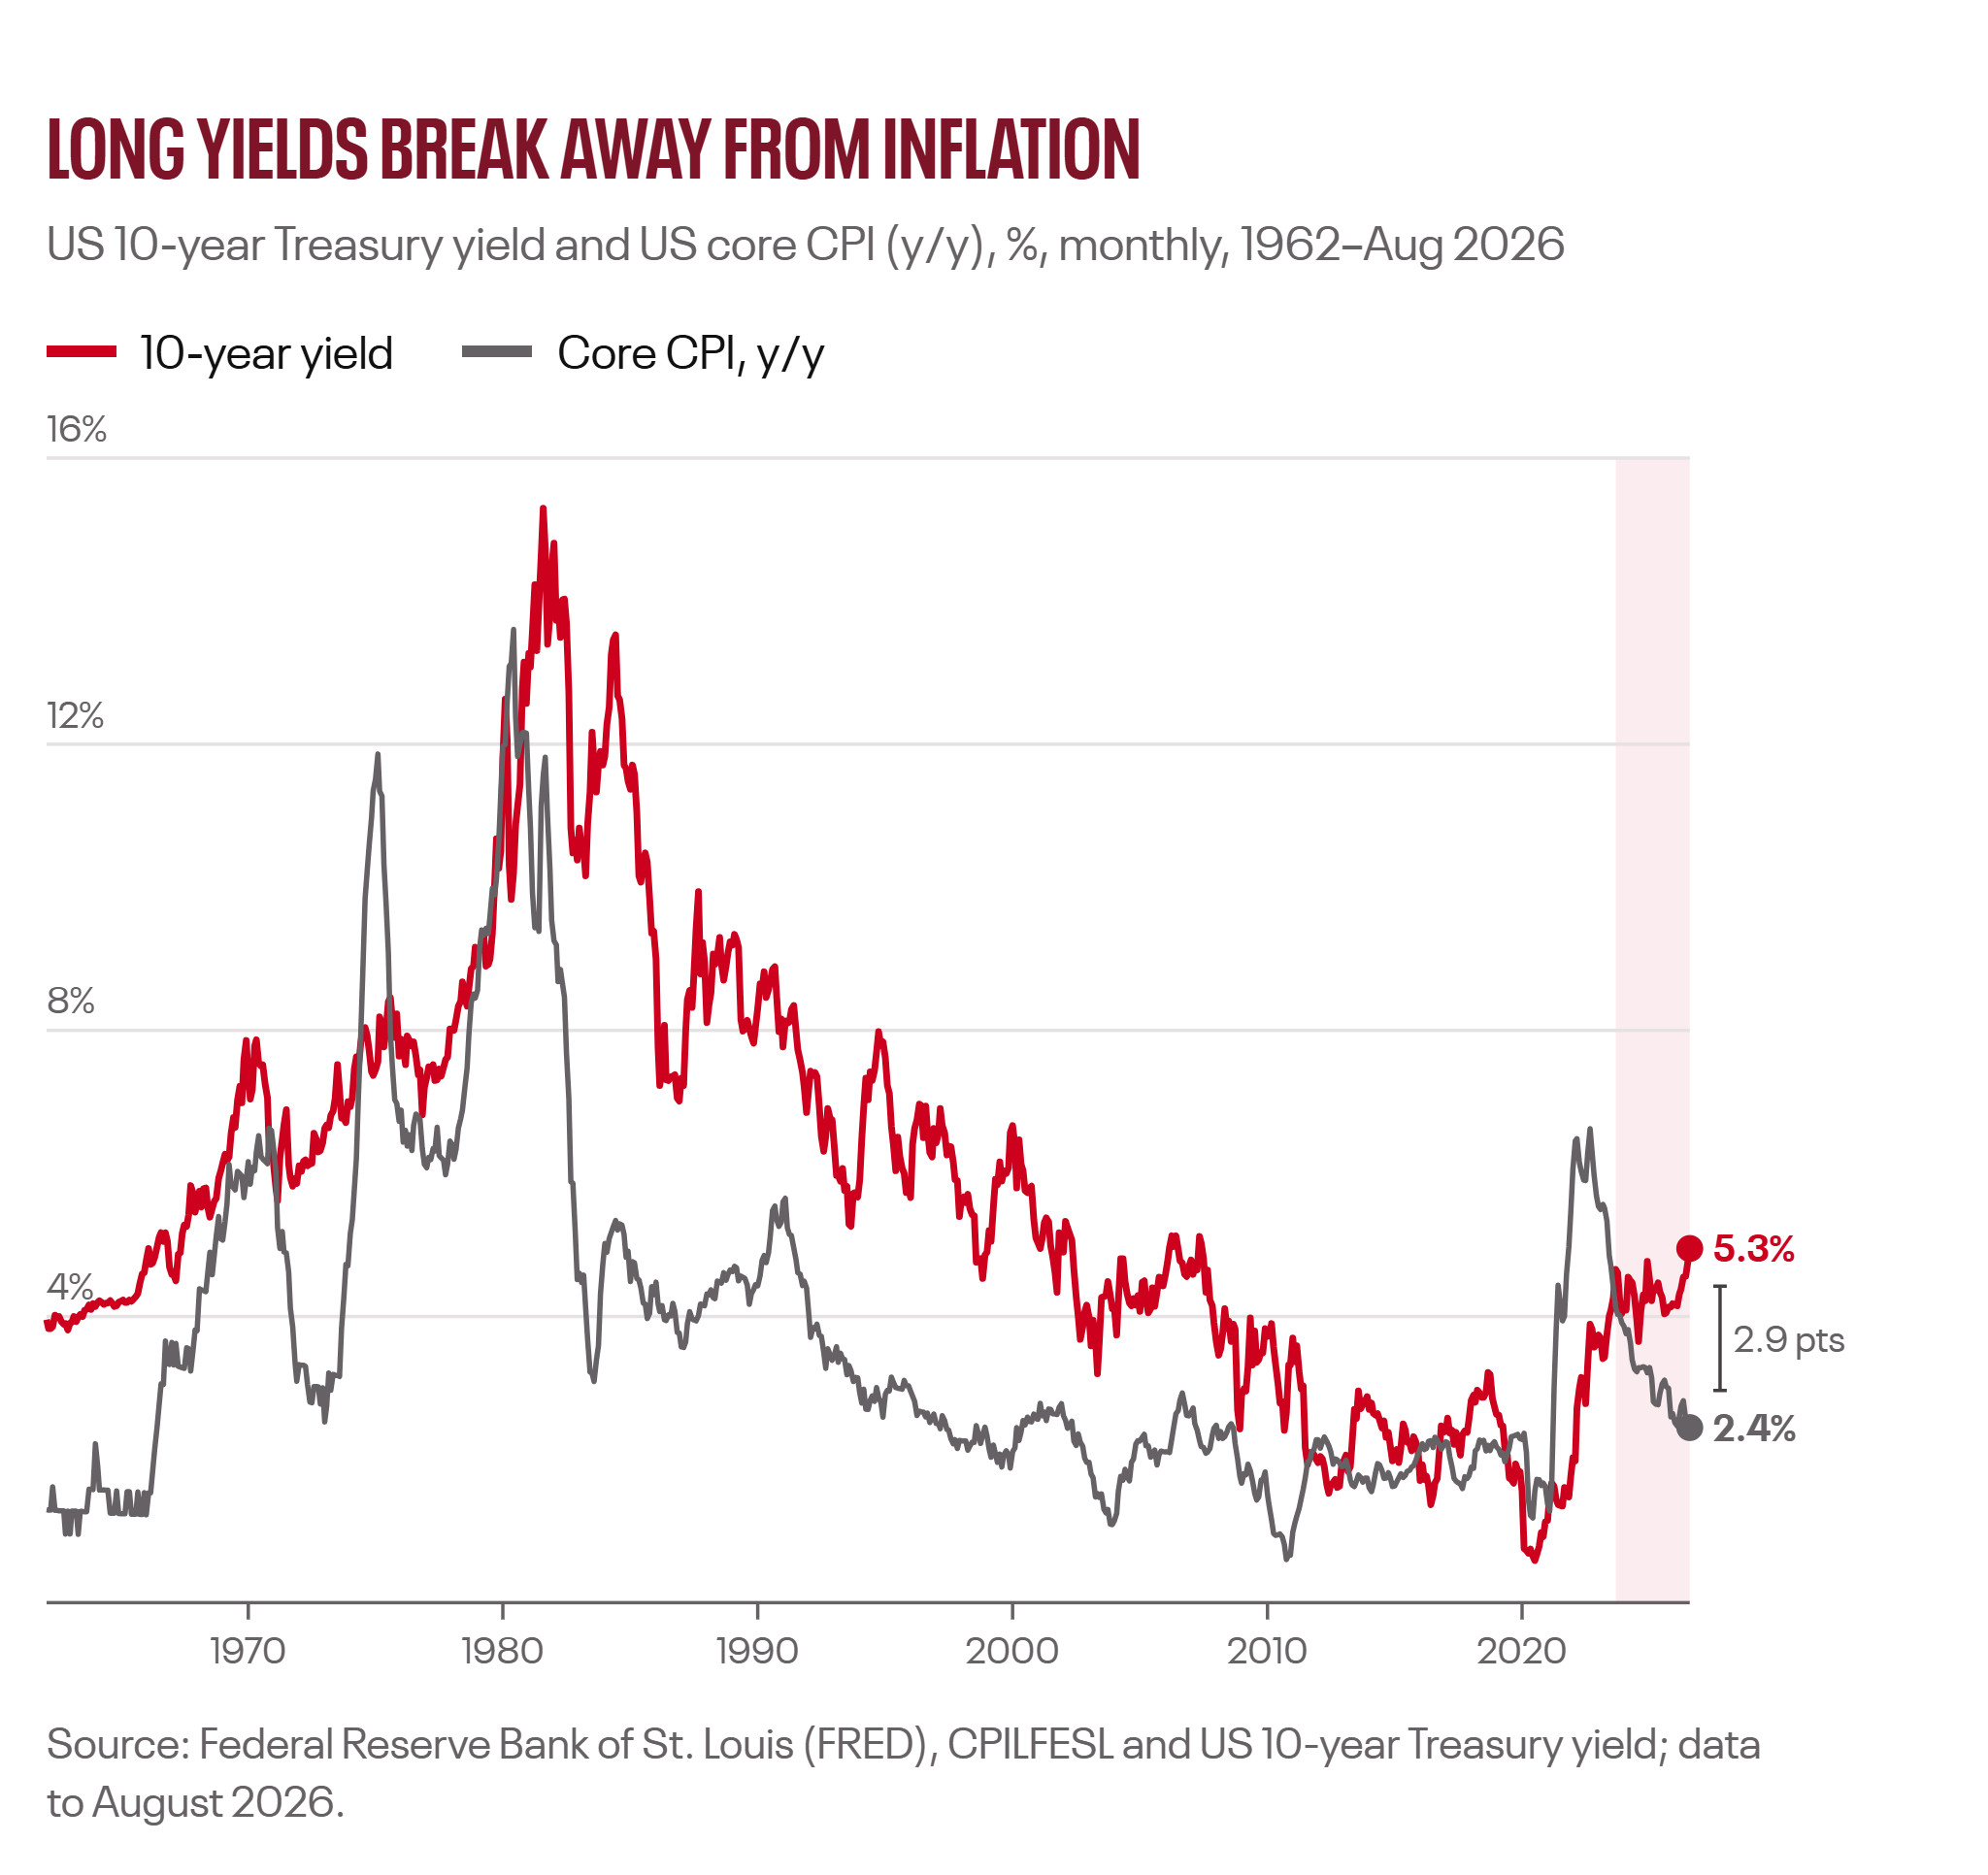
Description: Line chart of the US 10-year Treasury yield and US core CPI since 1962, showing the two series moving together for decades before diverging in 2025–26, with the yield at 5.3% and core inflation at 2.45%.
Two phases, five signposts
Our overall risk stance is neutral, with dry powder. We are underweight long-dated government bonds and overweight real assets, and we think of the path ahead in two phases.
In Phase 1, where we are today, central banks defend their credibility while the term premium rebuilds. Real yields stay high, curves steepen, and stocks and bonds can fall together. This is our base case, and it favours front-end bonds, short-dated credit, gold, energy and value.
In Phase 2, which we expect within 6–12 months, fiscal strain forces policymakers to cap the long end. Debasement assets rally broadly and the dollar weakens. We track five signposts for this pivot; two are on watch today: a Treasury shift towards bills or larger buybacks, and political pressure on the Fed after the midterms. We will add risk once two or more signposts are triggered and confirmed by a weaker dollar. At that point we would close duration underweights, broaden into growth and EM equities, and add EM local-currency duration.
What would change our mind: a growth scare or AI productivity gains that pull inflation and yields lower, credible fiscal consolidation, or a diplomatic breakthrough in the Strait of Hormuz.
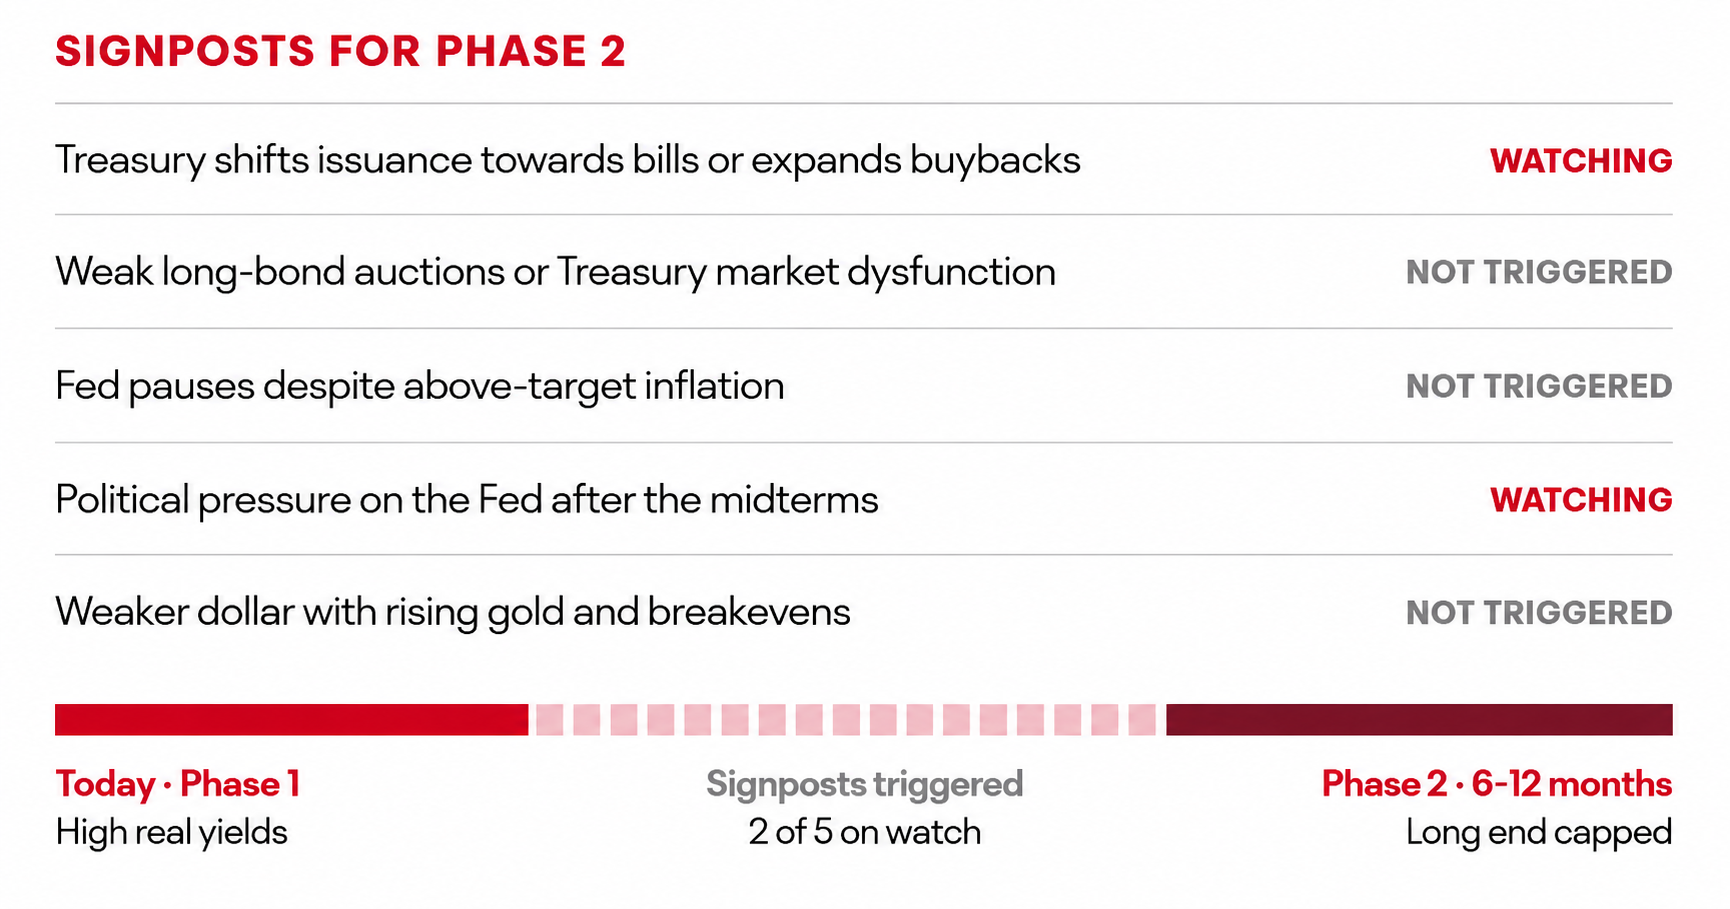
Description: Tracker of five signposts for a policy pivot, with two marked as watching and three not triggered, and a progress bar from Phase 1 today to Phase 2 in 6–12 months.
RATES
The long end has no natural buyer
The front end now prices a hawkish Fed and offers carry above 4%. The September hike was unanimous, and further repricing would need a clear re-acceleration in core inflation, which is not our base case.
The long end faces a structural problem. Supply is rising from fiscal deficits and record AI-related issuance, while price-insensitive buyers such as foreign central banks and Japanese investors are stepping back. Buybacks can smooth that supply, but they cannot offset it. Long-end yields are now at multi-decade highs across developed markets, from the US and UK to Japan.
We are underweight 10–30 year US Treasuries and neutral to positive on 2–5 years, holding 5s30s steepeners and preferring TIPS to nominals. We are neutral on the euro area and cautious on the UK, given limited fiscal room and heavy gilt supply. Japan is where we are most cautious: a disorderly rise in JGB yields is the main spillover risk. In Phase 2 we would close duration underweights but keep the TIPS preference.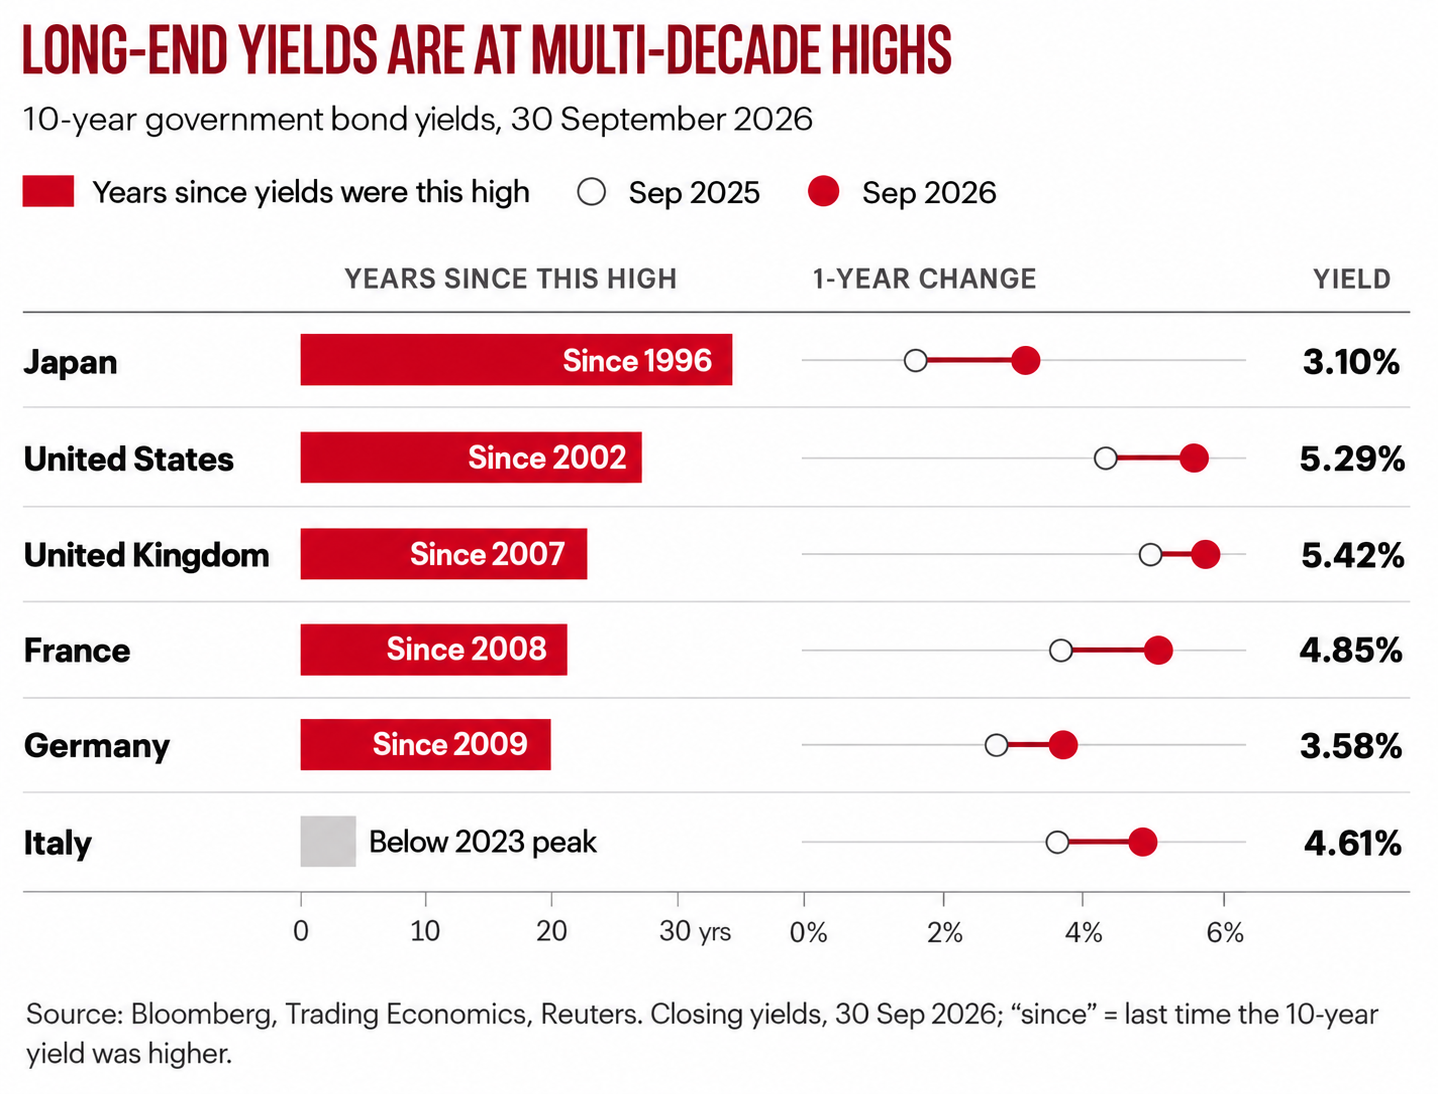
Description: Chart comparing 10-year government bond yields for Japan, the US, UK, France, Germany and Italy, showing how many years since yields were this high and the change over the past year; Japan's 3.10% is the highest since 1996 and the US 5.29% the highest since 2002.
CREDIT & EM DEBT
Own the borrower, not the duration
Financial repression is kind to borrowers. Nominal growth stays high, debt erodes in real terms and default risk stays contained. We would rather be paid for credit risk than for duration risk.
The risk sits in duration and supply. Long-dated investment grade is sensitive to a rising term premium and carries the heaviest issuance pipeline as hyperscalers fund the AI build-out. AI-related issuance has climbed every quarter since 2023, and IG spreads have started to widen again. Parts of the IG market are not a hedge against crowding out; they are the crowding out.
We favour short and intermediate IG, and short-maturity high yield for carry, while avoiding rate-sensitive issuers. Commodity exporters are the clearest winners in EM: higher energy, metals and gold prices lift export receipts, fiscal revenue and reserves, yet spreads remain wider than fundamentals justify. We favour short hard-currency sovereigns with strong external balances, including frontier and Central Asian Eurobonds. We are selective in local currency and would add duration there in Phase 2.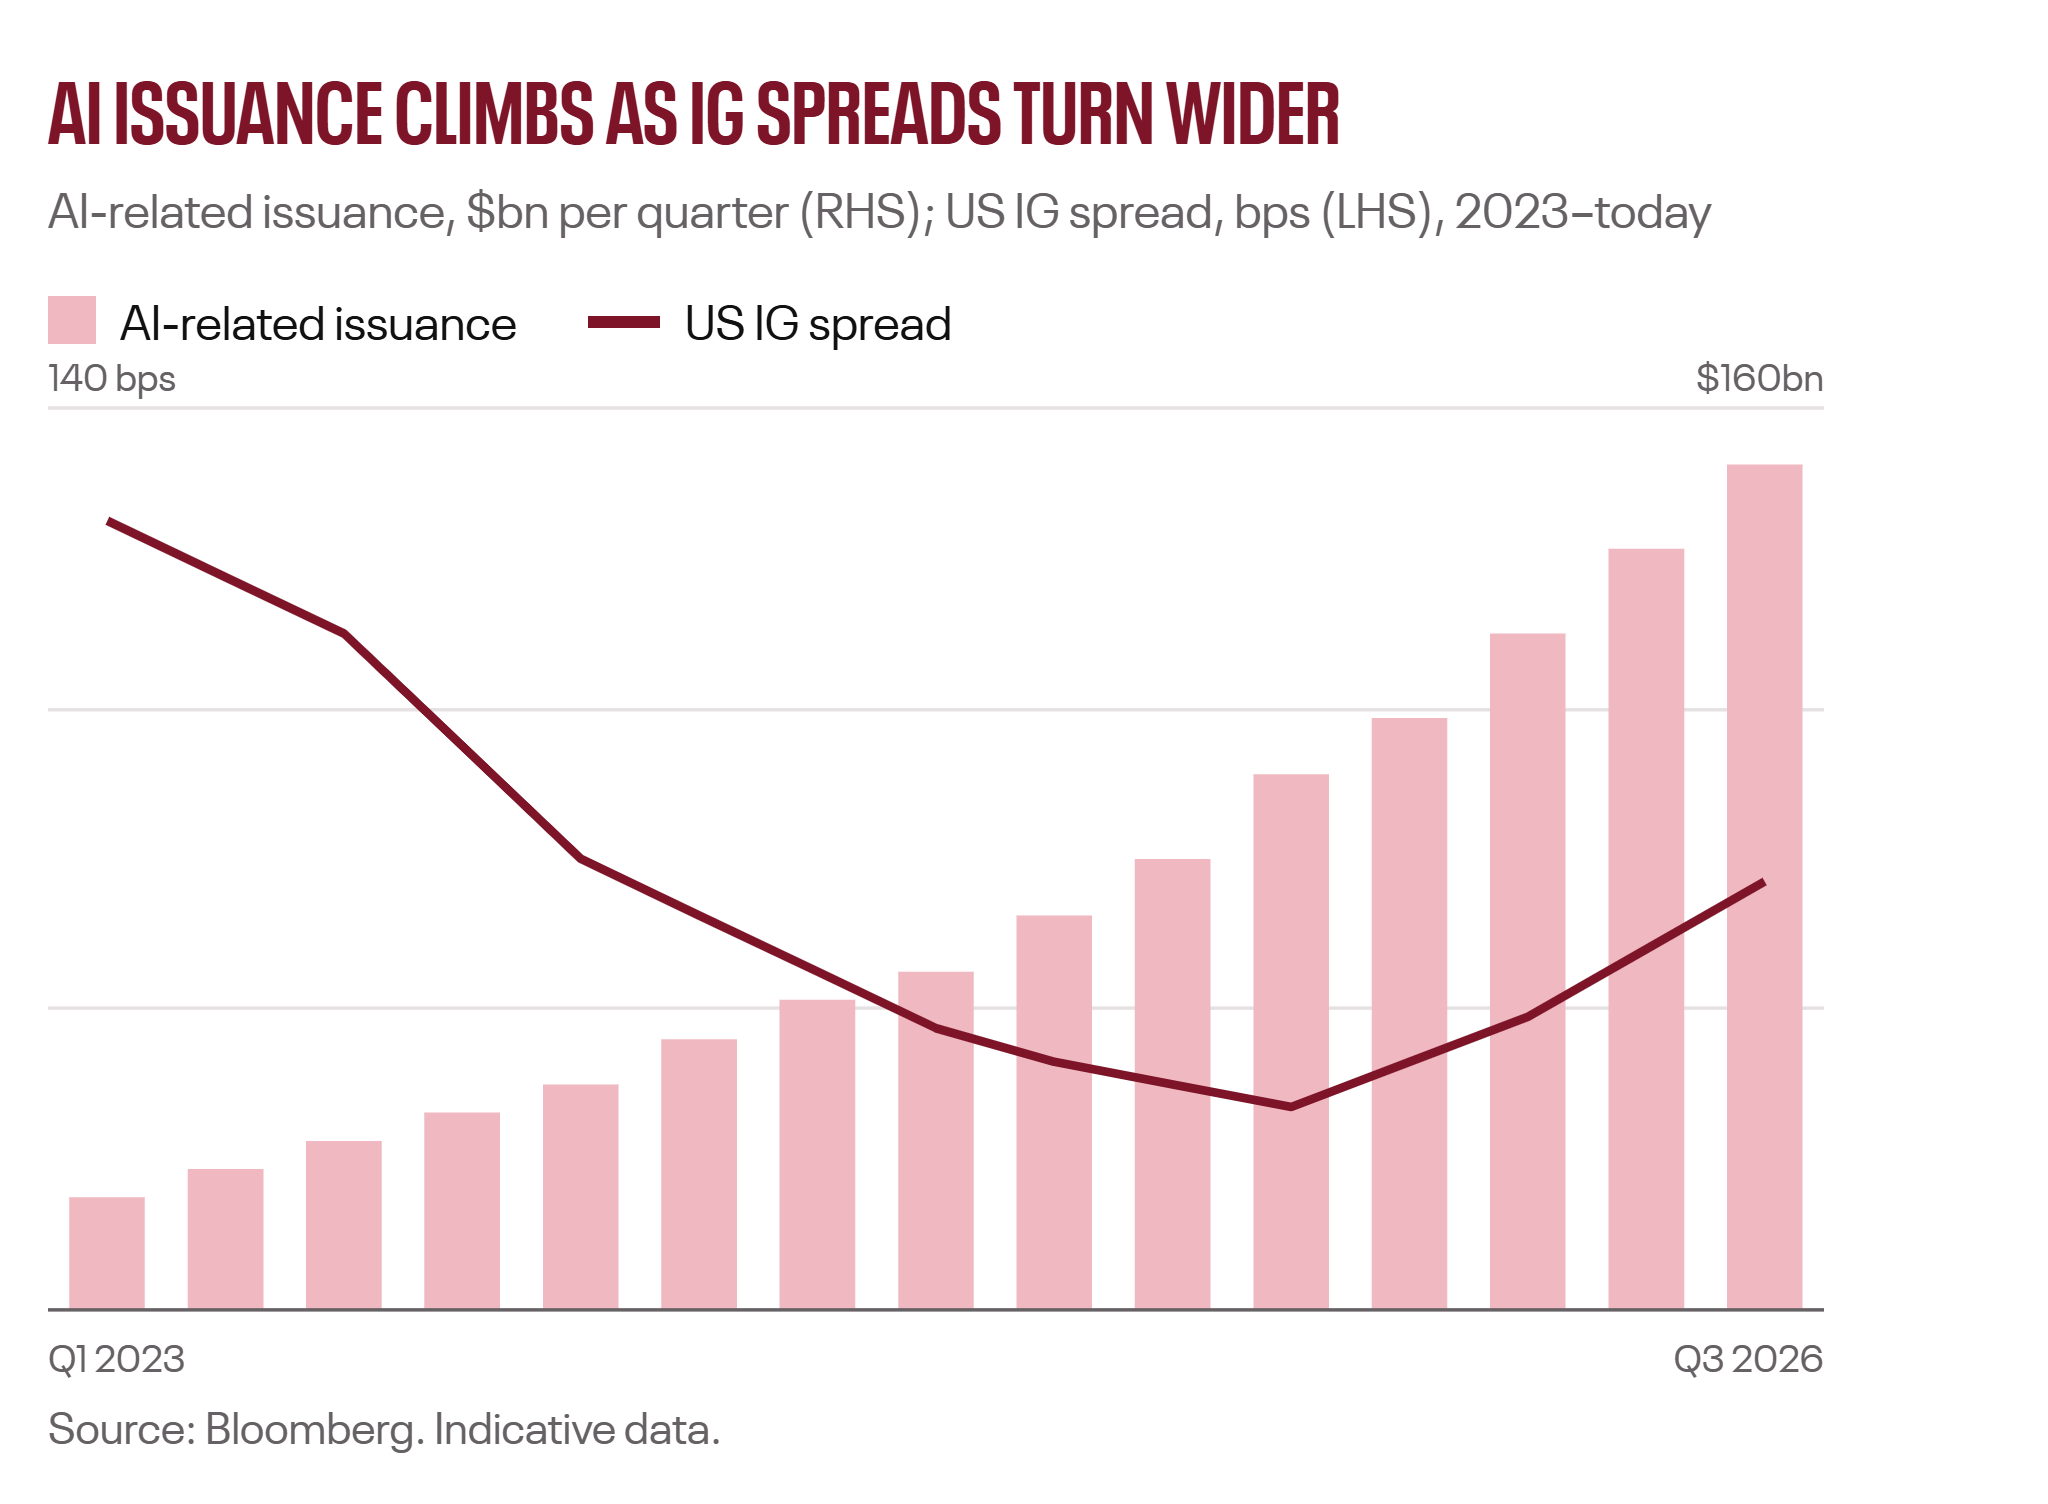
Description: Bar and line chart showing quarterly AI-related bond issuance rising steadily from Q1 2023 to Q3 2026, while the US investment-grade spread fell until mid-2025 and has since started to widen.
EQUITIES
Nominal assets, real selectivity
Equities have looked through the bond sell-off. With stocks near record highs and the 10-year yield above 5%, the equity risk premium is at historically thin levels. In the US, the forward earnings yield is now roughly equal to the 10-year Treasury yield, leaving no extra return for owning stocks. Japan and Europe still offer a cushion of about 3 percentage points.
Debasement helps equities only when yields are capped, as in 2020–21. When yields rise freely, as in the 1970s, stocks and bonds fall together. Phase 1 therefore argues for selectivity over broad market exposure.
We are neutral overall. In the US we prefer equal-weight and value to mega-cap growth. Japan is our preferred region, supported by a weak yen, the end of deflation and governance reform. At sector level we favour energy, materials and banks, along with AI's physical infrastructure: power, grids and capital goods. In EM we favour commodity exporters and Latin America. The key risk to this view is an AI-led earnings surge that keeps mega-cap growth leading even with yields above 5%.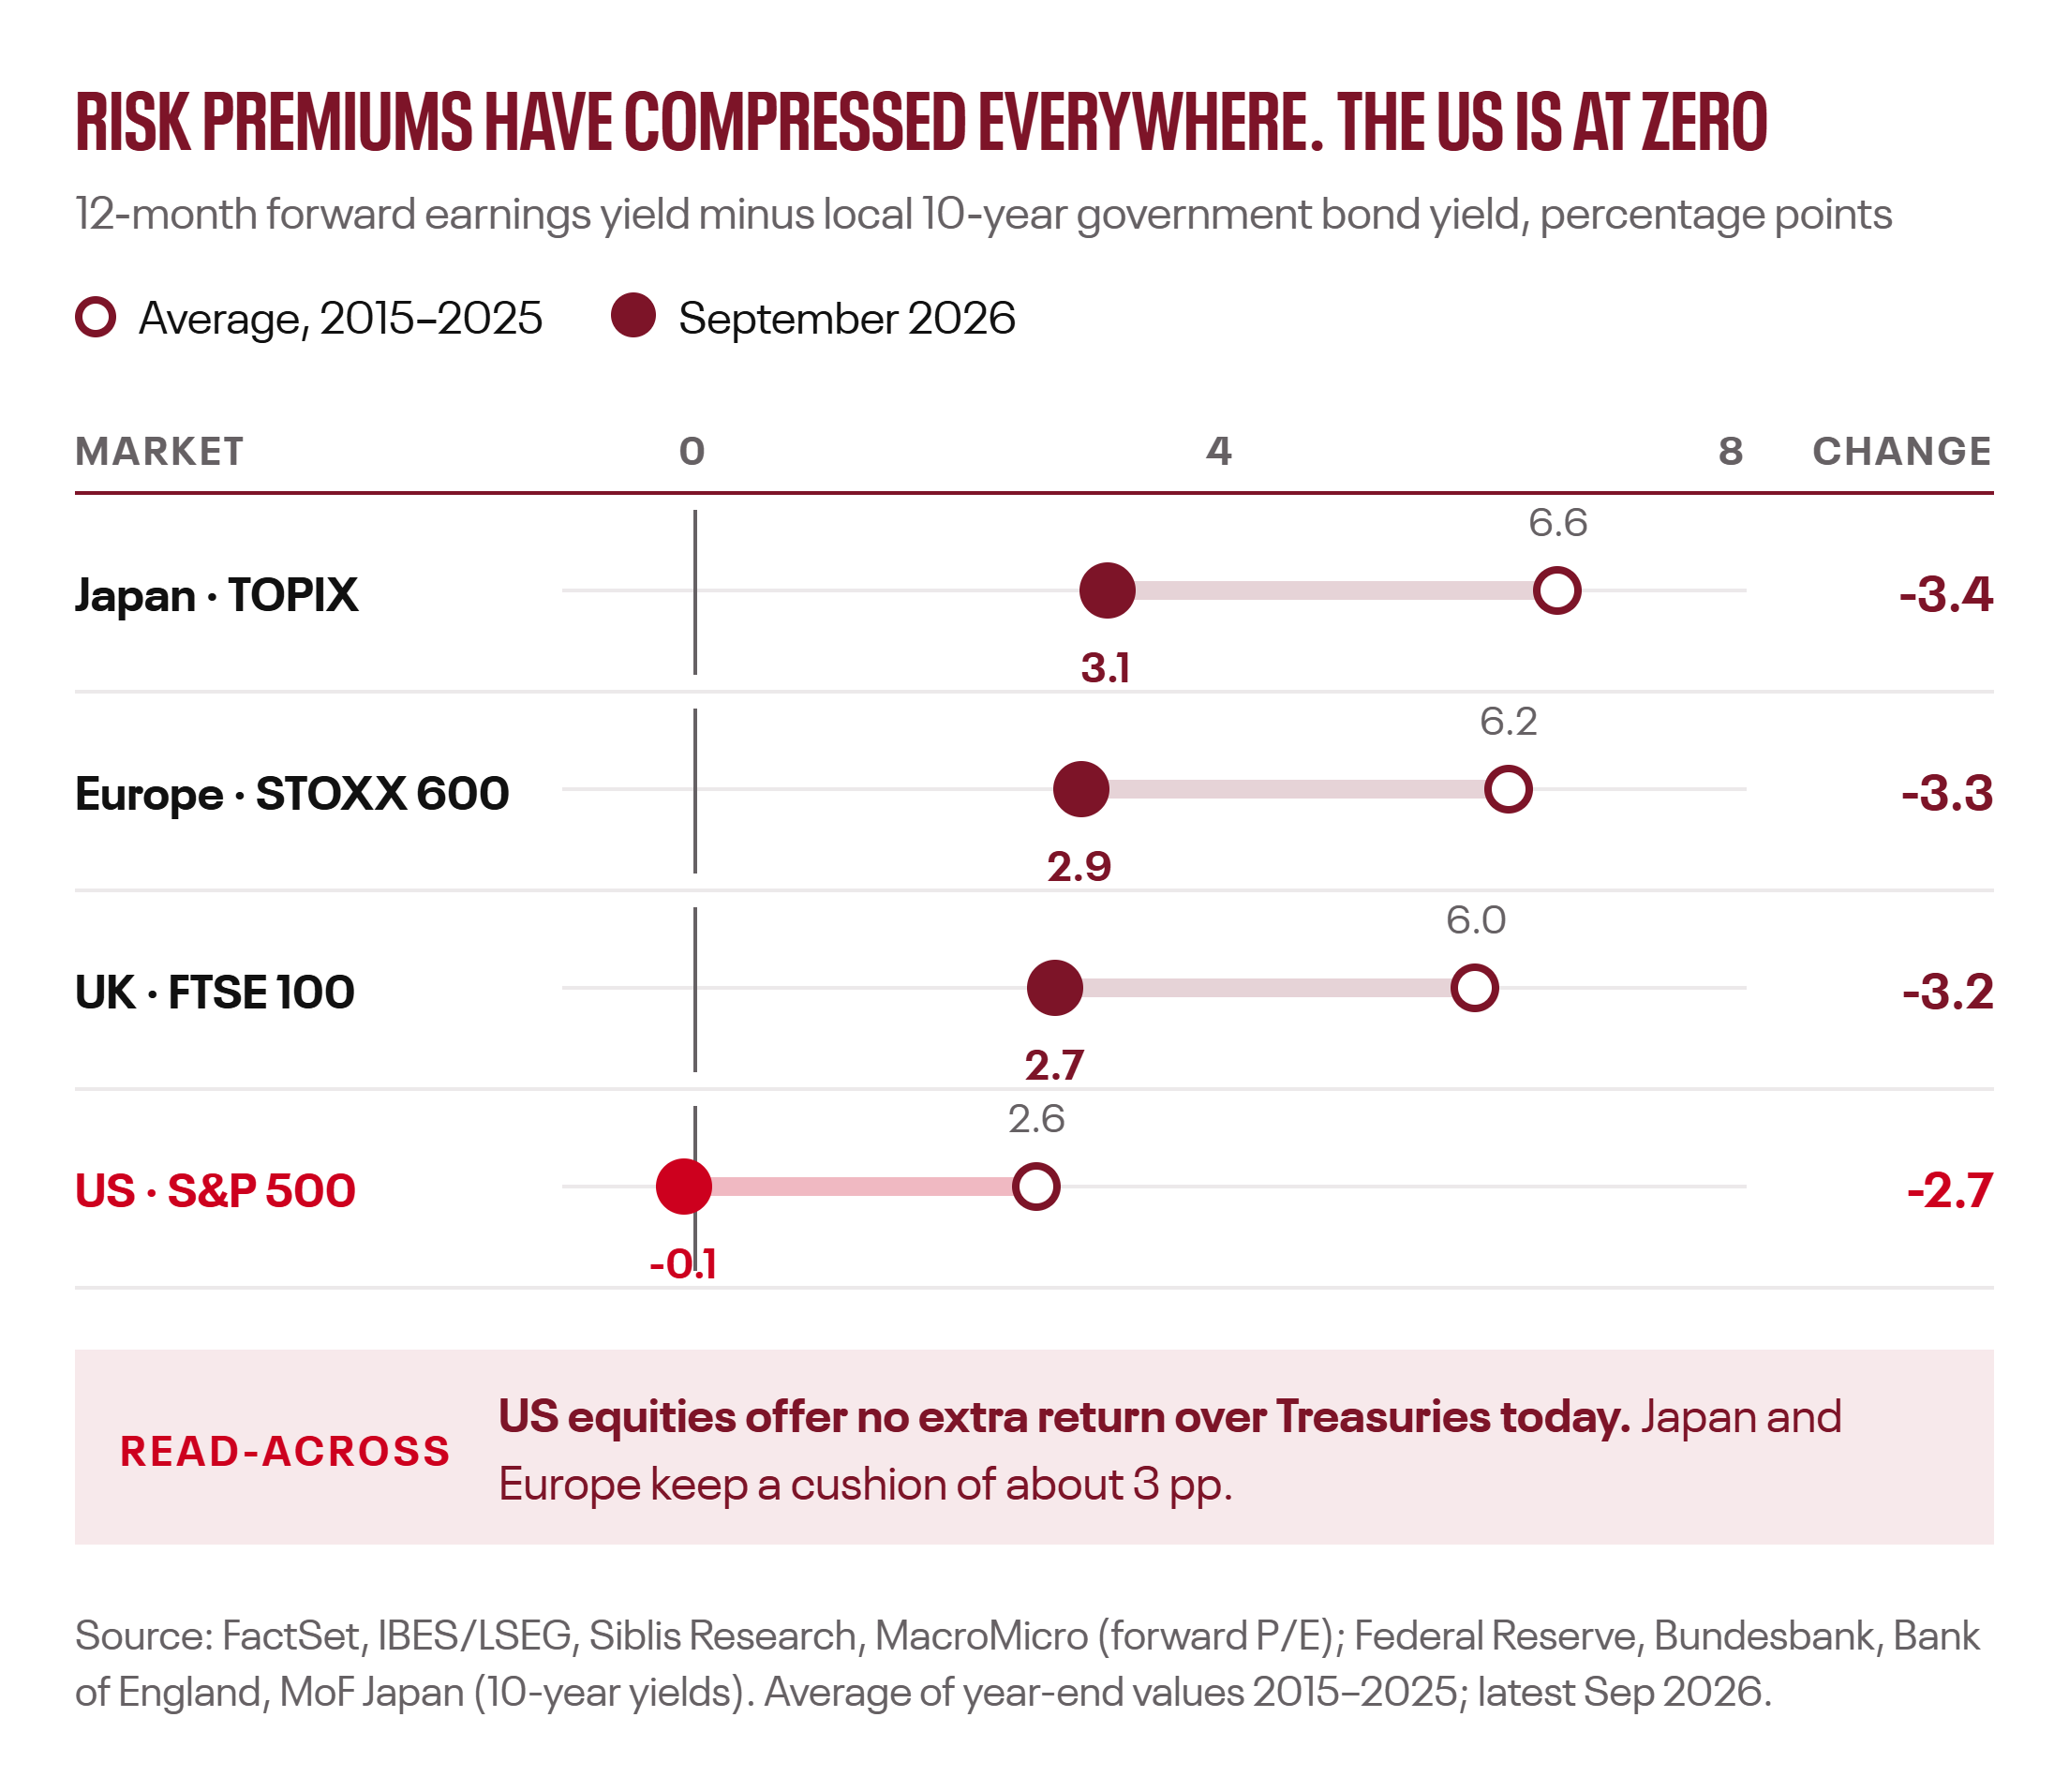
Description: Dot chart of the equity risk premium in Japan, Europe, the UK and the US, showing each market well below its 2015–2025 average and the US S&P 500 at about zero (−0.1 percentage points).
COMMODITIES
The asset class that works in both phases
Gold is our highest-conviction overweight. It fell around 4% in September to roughly $4,200 an ounce, but we see that as a consolidation, not a peak. Demand is now driven by central banks and Chinese investors, who are less sensitive to real yields; that is why gold has decoupled from real yields over the past few years. We would use weakness to build positions ahead of Phase 2.
Commodities play a role in both phases. In Phase 1 they hedge the supply-driven inflation that keeps central banks hawkish. In Phase 2 they are the most direct beneficiaries of currency debasement.
On oil we are neutral, with high two-way risk. Strait of Hormuz traffic is around 10 vessels a day, against 130 before the conflict, keeping Brent in the $90s; a diplomatic breakthrough could take $15–20 a barrel off the price. We therefore prefer energy equities, with their cash flows and dividends, to outright crude. We are constructive on copper, where electrification, grids and data centers support a structural deficit, and we are watching food prices for second-round inflation risk.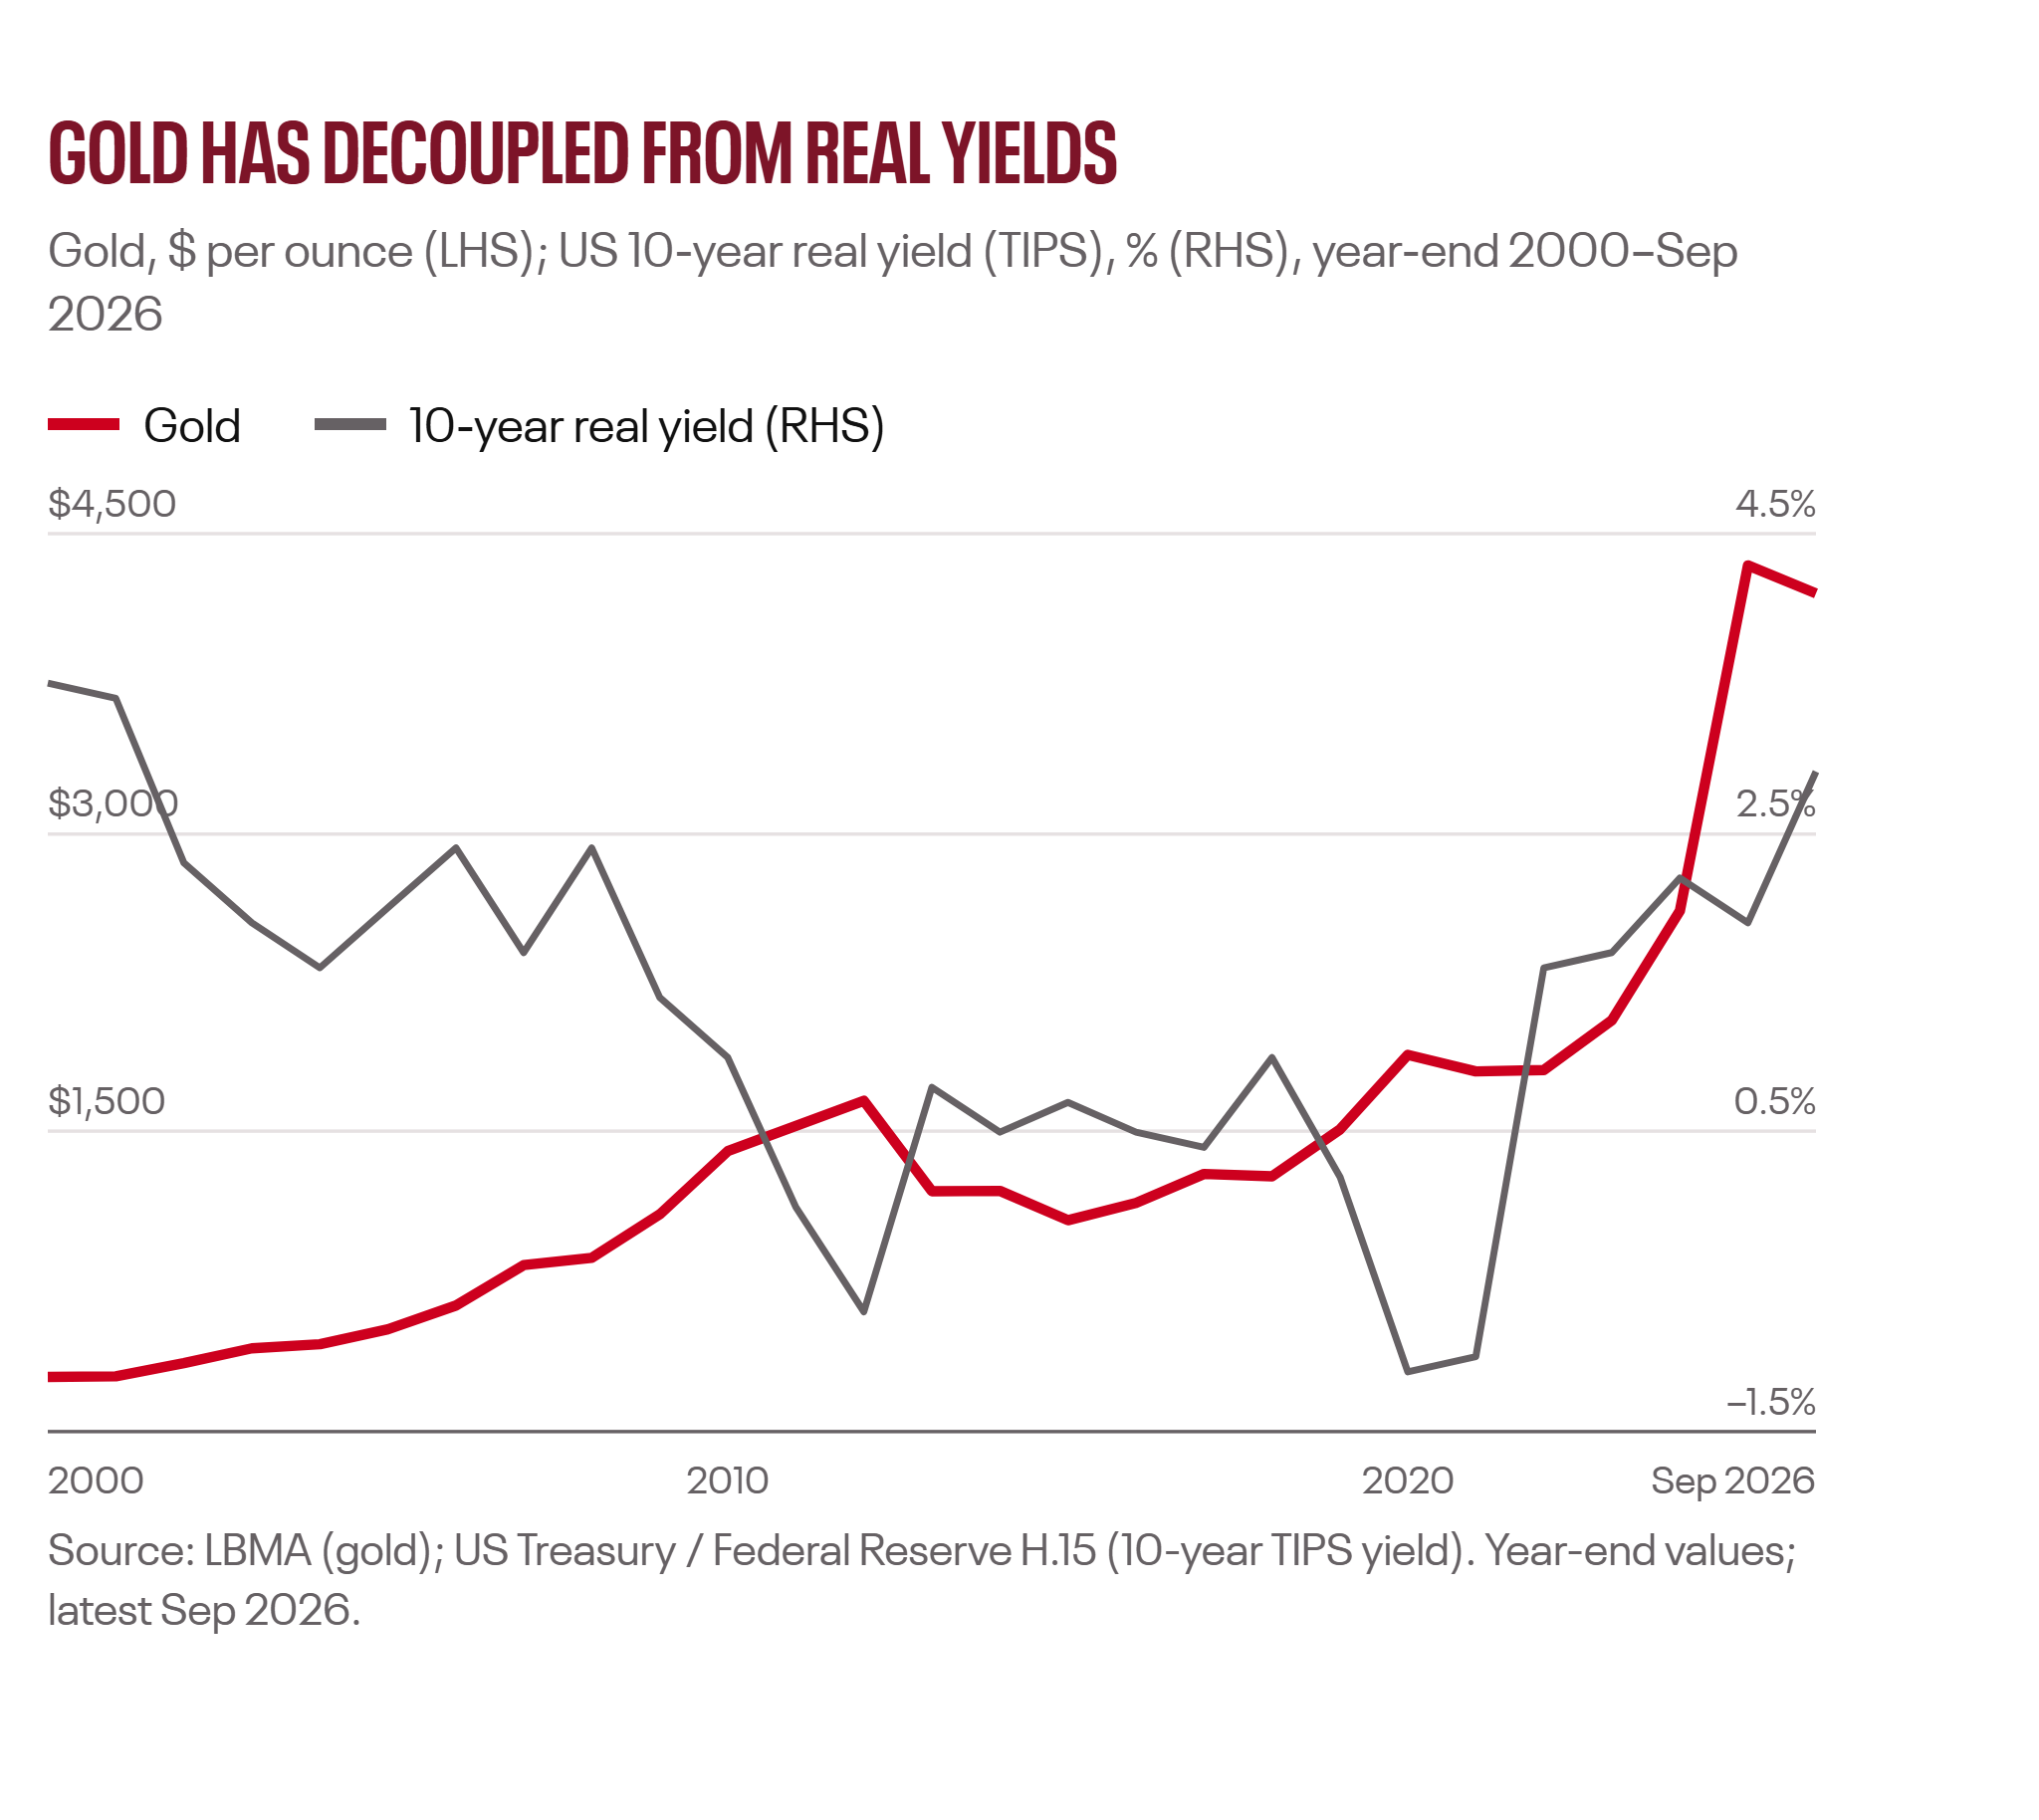 Description: Line chart of the gold price and the US 10-year real yield since 2000, showing the two moving in opposite directions for two decades before gold rose to about $4,200 even as real yields climbed back above 2%.
FX
The dollar's carry is a bridge, not a floor
The dollar has held up despite the debasement debate, trading in a 99–100 range on the Dollar Index in September. It is supported by a Fed that is hiking decisively, while other central banks move more cautiously; USD/JPY stayed above 157 even after the BoJ's hike.
That support is temporary. Once policy shifts towards capping long-term yields, the same rate advantage that props up the dollar today would erode quickly. We expect the decisive move lower to coincide with Phase 2. Over the longer run, gold has far outpaced the dollar: since 2008 it is up around 412%, against 34% for the trade-weighted dollar.
We are tactically neutral on the dollar and strategically bearish. We favour high-carry EM currencies and the yen via options; the yen is cheap on every long-term measure, but the rate gap keeps the carry trade alive. We are neutral on the euro, where ECB support is offset by growth and energy exposure, and we avoid low-yield Asian currencies. In Phase 2 we would move decisively underweight the dollar and add EM local-currency exposure.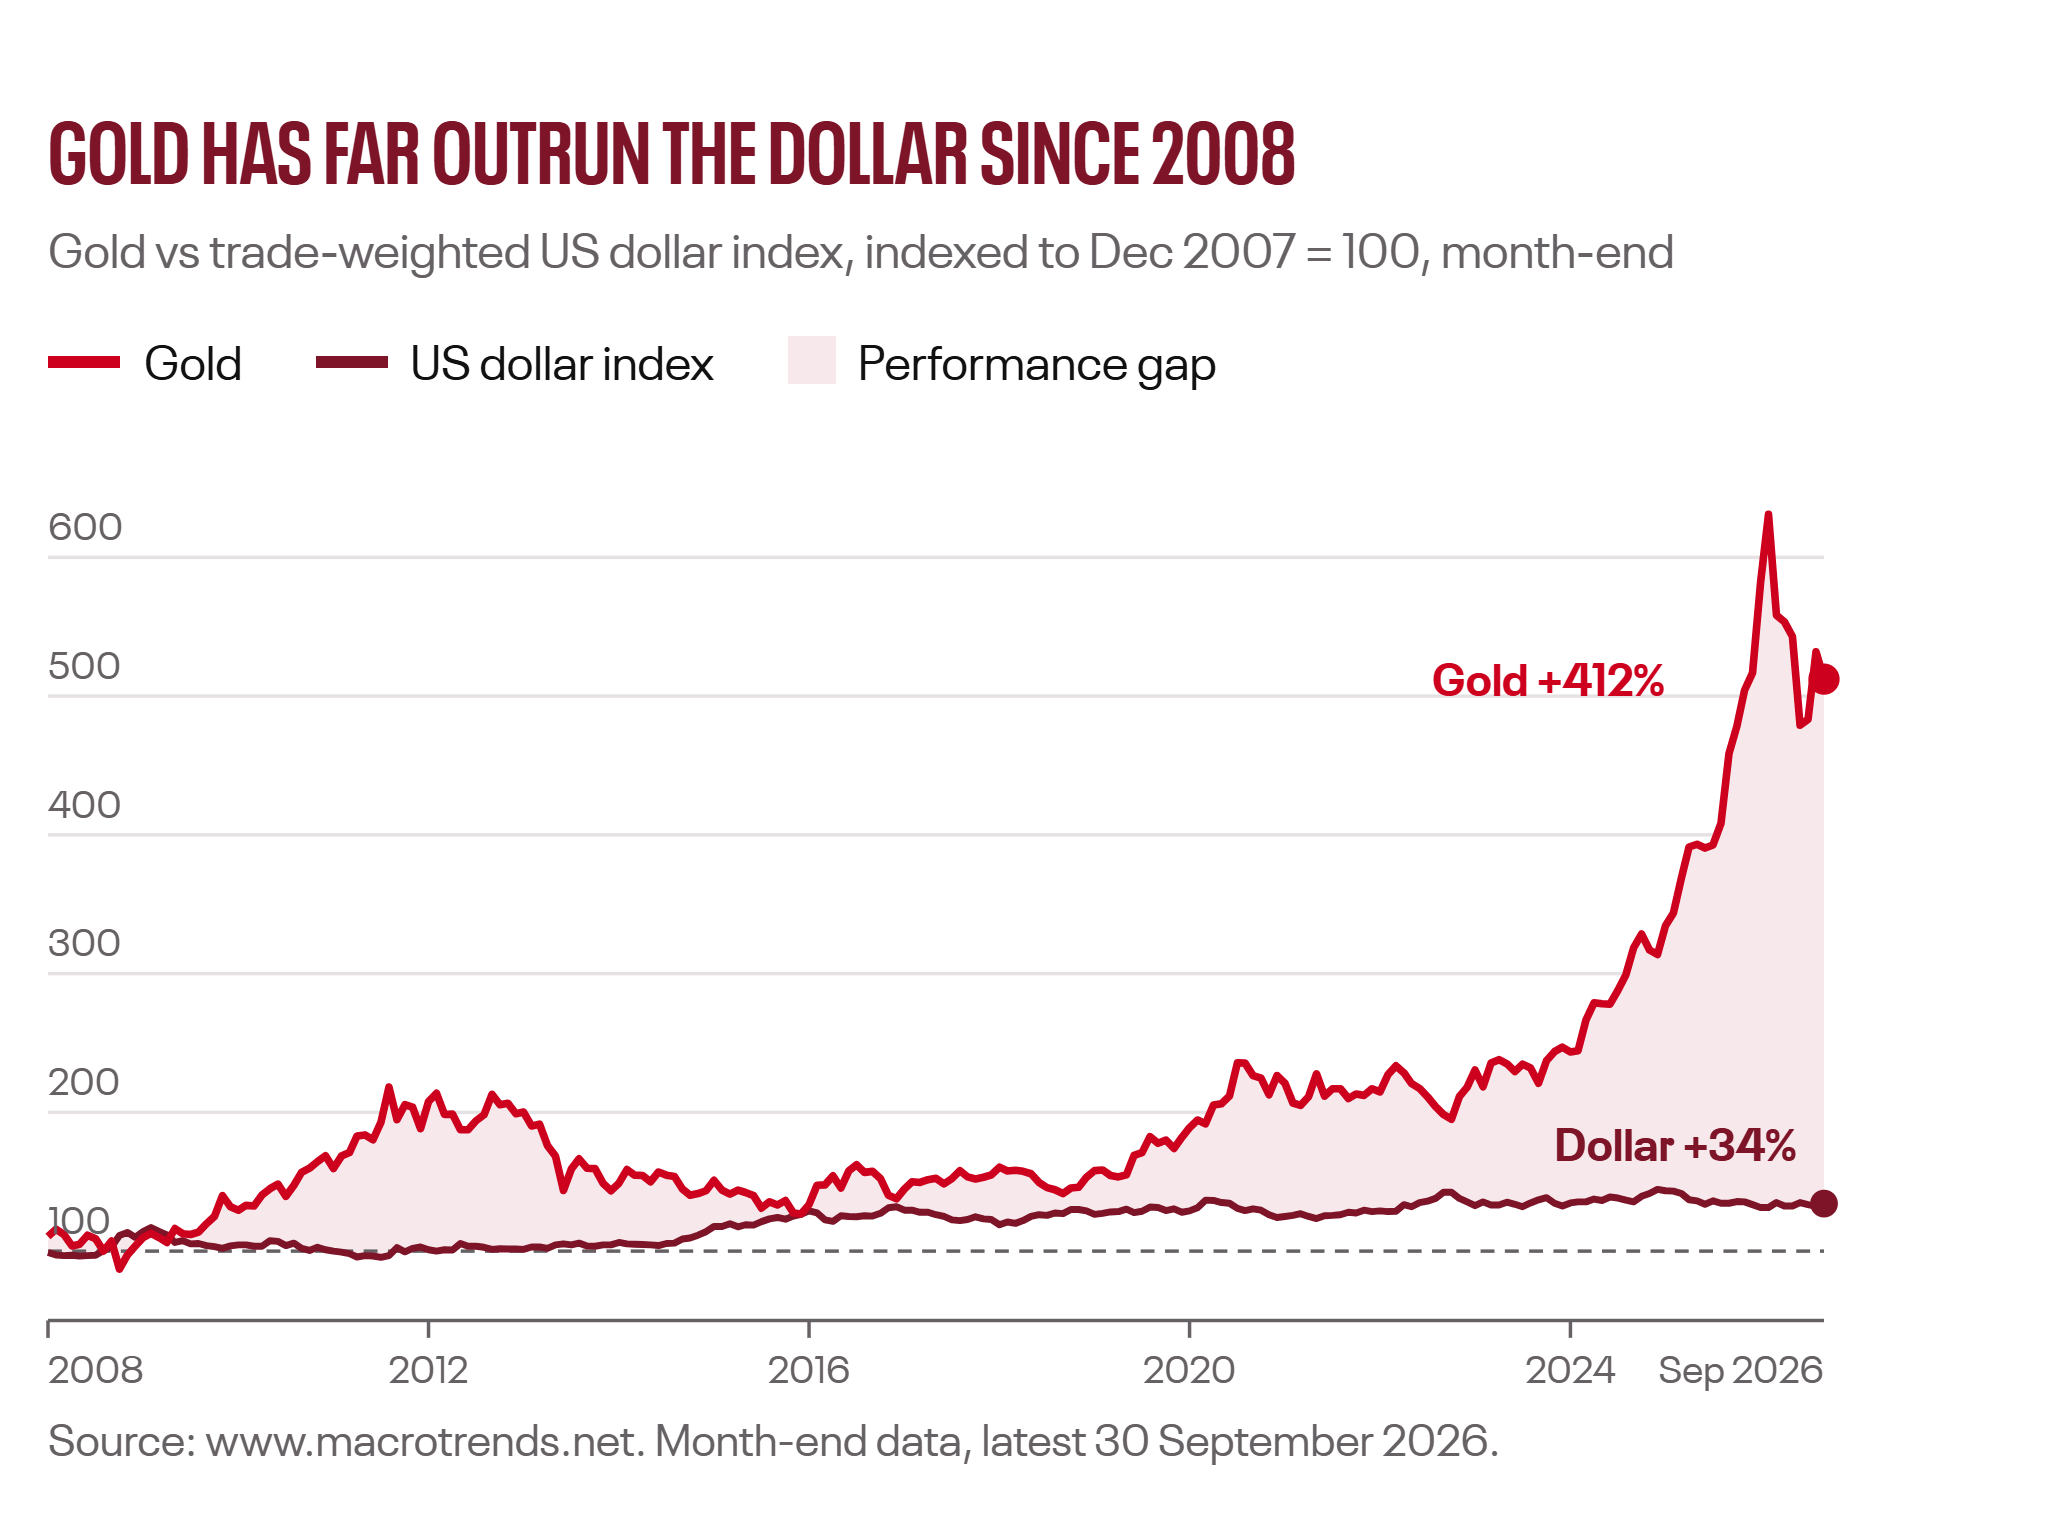
Description: Indexed line chart from 2008 to September 2026 showing gold up about 412% and the trade-weighted US dollar up about 34%, with the gap widening sharply since 2024.
PRIVATE MARKETS
Where the AI leverage hides
The AI build-out is the largest private capital spending cycle in decades. A growing share is financed through private credit funds, joint ventures and special-purpose vehicles that keep debt off corporate balance sheets. Alternative assets financed a record $131bn of data-centre deals in 2025.
This matters in two ways. Private credit is part of the crowding out we see in public markets. And private valuations adjust more slowly: with long yields above 5%, reported marks may not yet reflect the higher cost of money. Private credit is where we see the most important hidden risk in today's cycle.
We are selective. We prefer senior secured, floating-rate lending with strong covenants, and infrastructure, where contracted, inflation-linked cash flows from power and grid assets fit both phases. Secondaries offer entry at discounts to marks, and we consider pre-IPO only where a listing path is credible. We are cautious on buyouts in Phase 1 and avoid concentrated AI-infrastructure exposure and borrowers relying on payment-in-kind. The early warning signs we monitor are slower exits, delayed distributions and rising PIK use.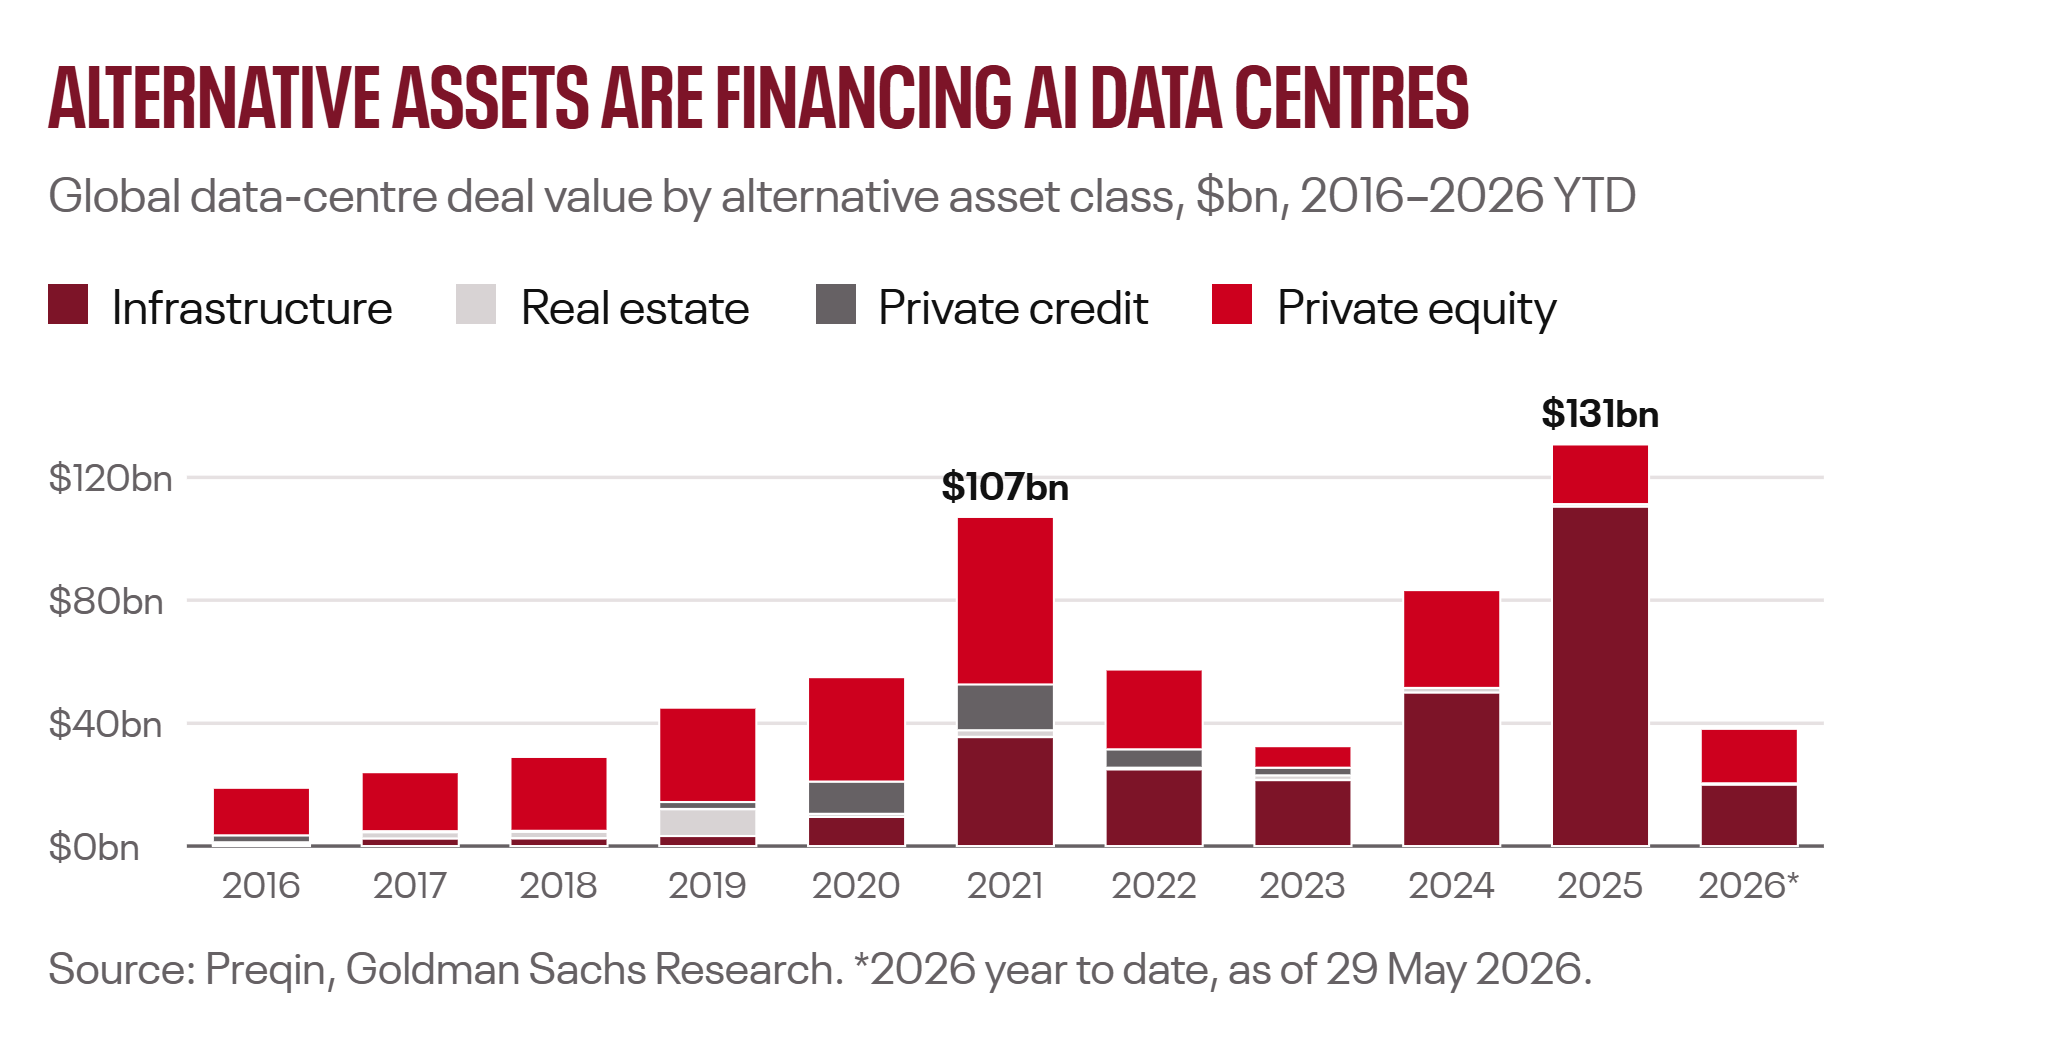
Description: Stacked bar chart of global data-centre deal value financed by infrastructure, real estate, private credit and private equity from 2016 to May 2026, peaking at $107bn in 2021 and a record $131bn in 2025, led by infrastructure.
VIEWS
Our views at a glance
Our strongest overweight is gold, which works in both phases of our framework. Our strongest underweight is the US long end and Japanese government bonds, where the long end has no natural buyer. Our preferred equity region is Japan, a live example of nominal assets in a debasement environment.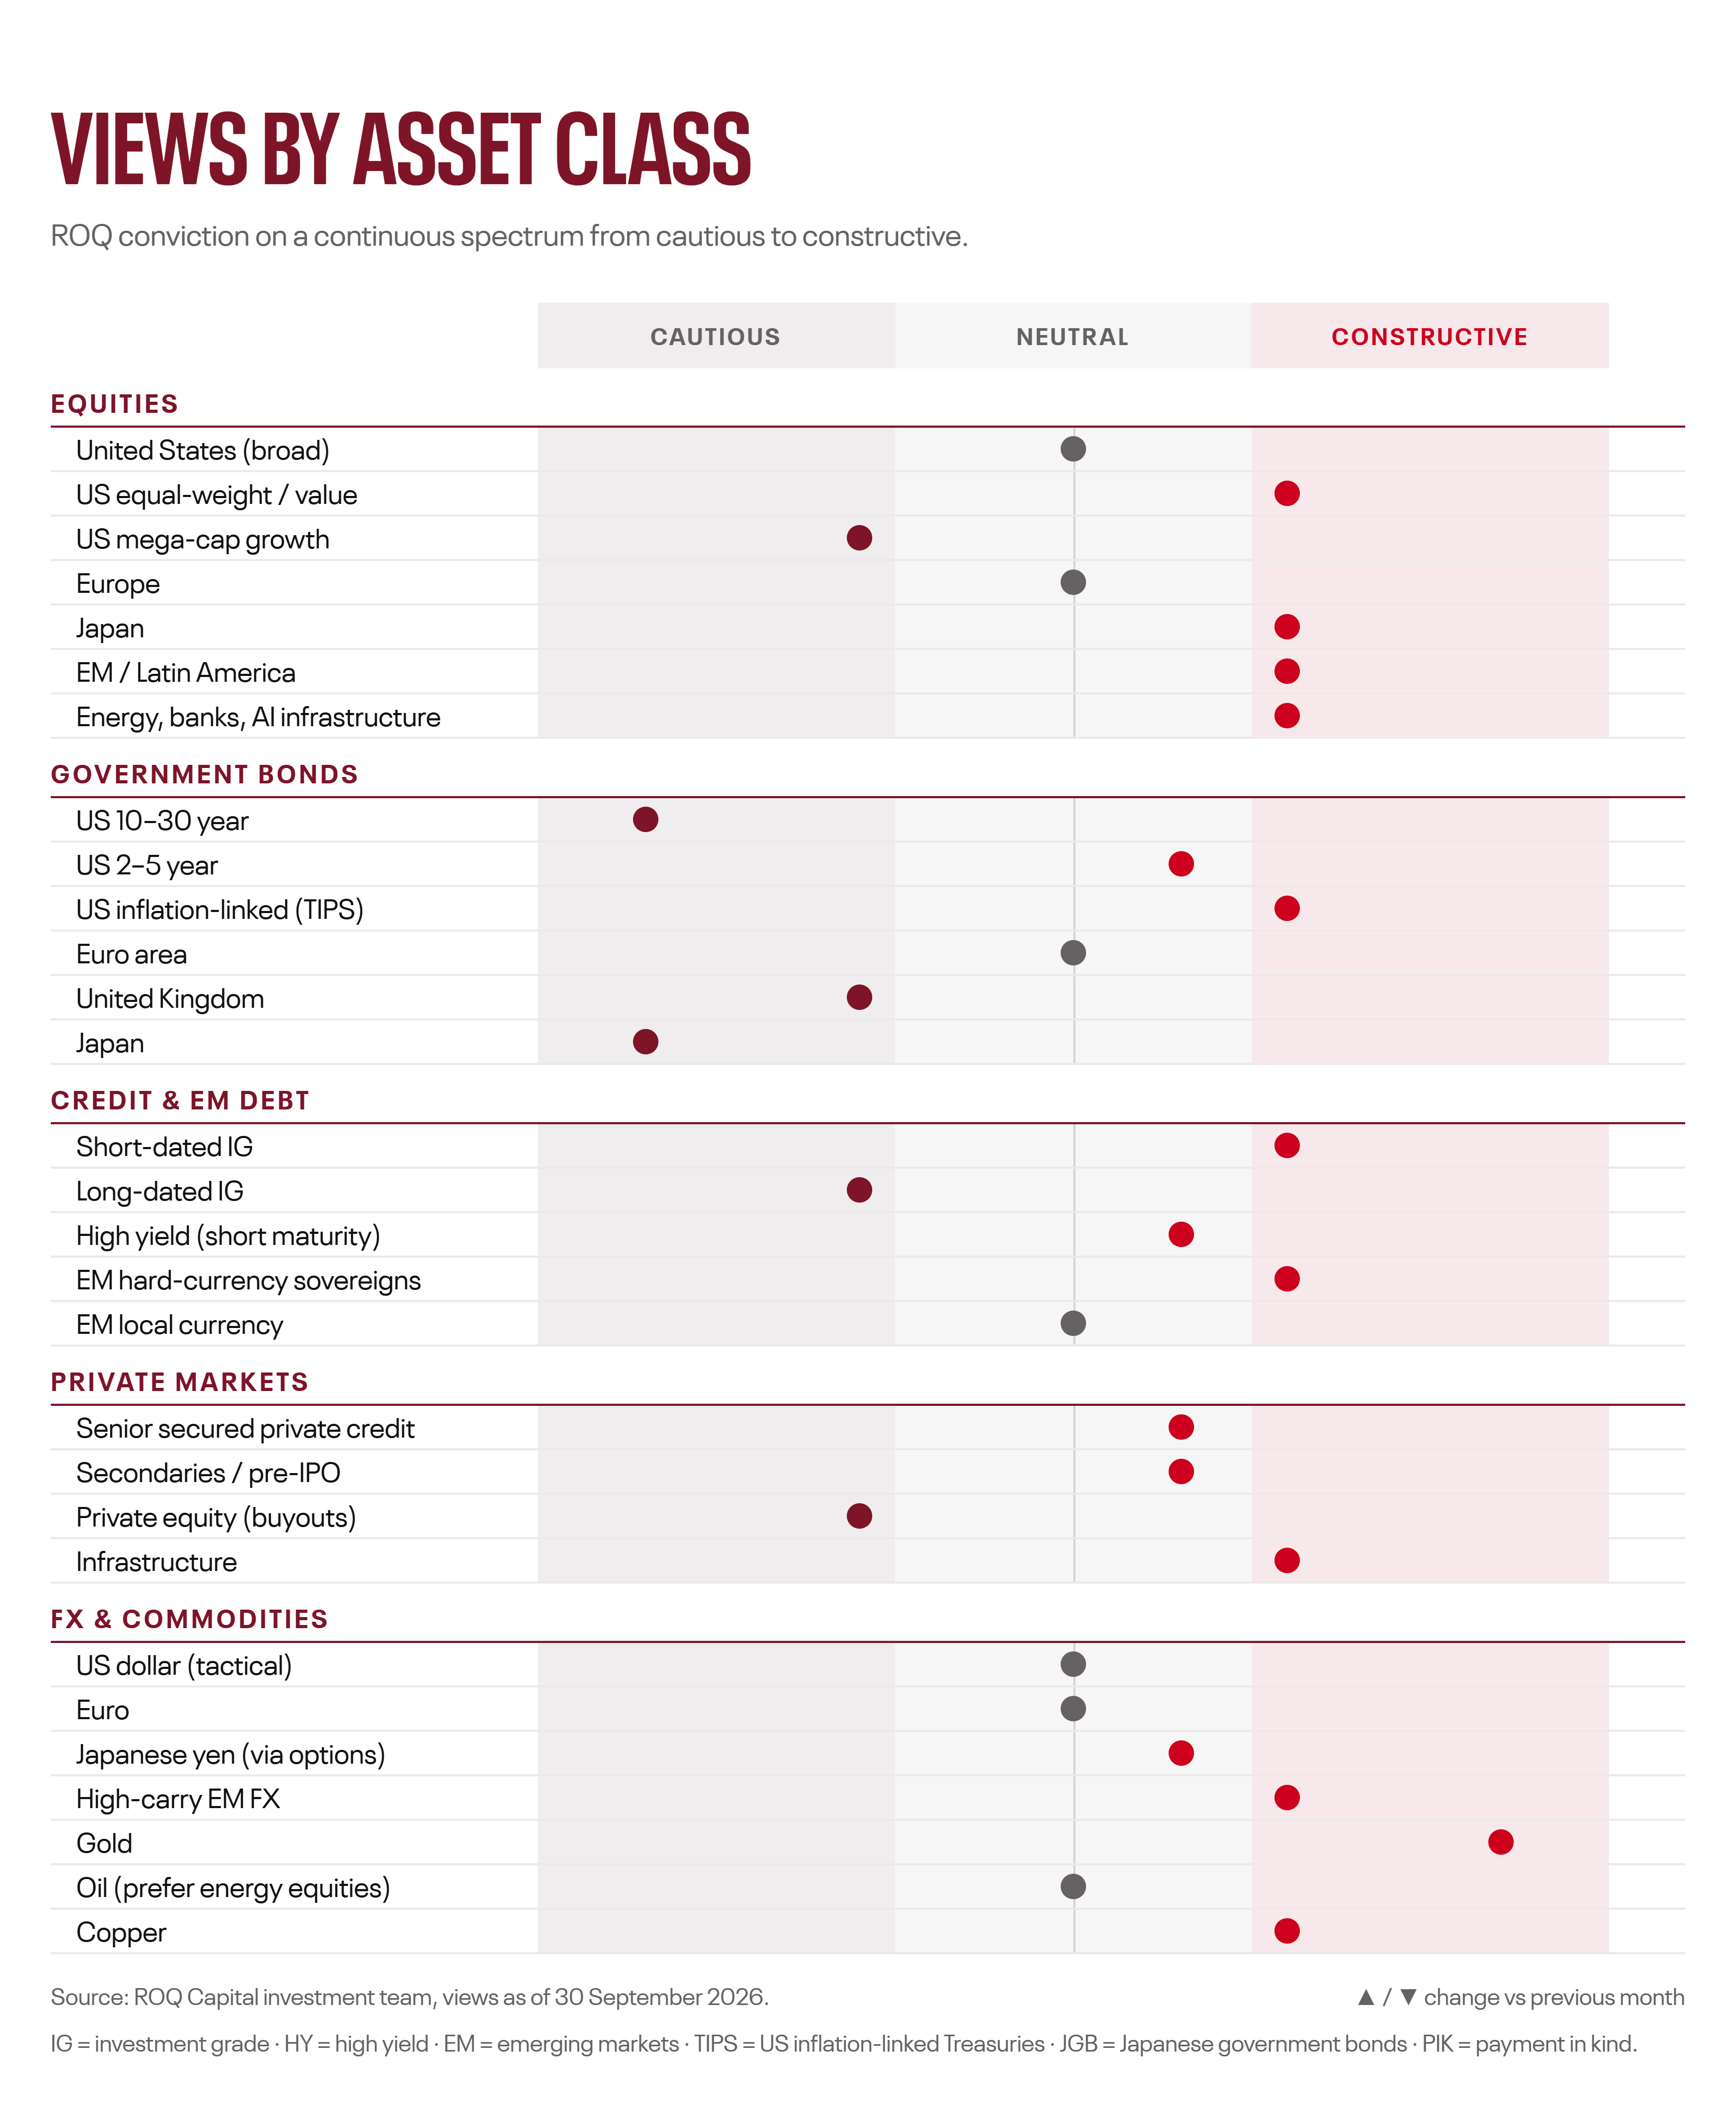
Description: Conviction chart placing about 30 asset classes on a scale from cautious to constructive, with gold, Japanese equities and short-dated credit among the most constructive and long-dated US Treasuries and JGBs among the most cautious.
ARMENIA & CIS
What this means for investors in Armenia and the CIS
The dram strengthened in September, by 0.5% against the US dollar and 2.6% against the euro, while weakening 3.3% against the ruble. The Central Bank of Armenia raised its refinancing rate by 25 bps to 6.75% on 15 September.
In Phase 1, dollar cash and short-dated dollar bonds remain attractive, offering carry above 4% with limited risk. But if the dollar enters a debasement phase, portfolios concentrated in dollar cash and long Treasuries would lose purchasing power. We recommend diversifying gradually into gold, real-asset equities and non-dollar exposure, rather than waiting for the turn to become visible in prices.
Description: Bar chart of the monthly change in the dram exchange rate: −0.5% against the US dollar and −2.6% against the euro (dram stronger), and +3.3% against the ruble (dram weaker).
Read the full analysis, including our scenario map, the five Phase 2 signposts and detailed views across more than 30 asset classes.
Download the Full October 2026 Monthly House View (PDF)
Authors
• Andranik Gzoghyan, CFA, FRM - Chief Investment Officer
• Edgar Nikoghosyan - Investment Analyst
• Eduard Avetisyan - Junior Investment Analyst
• Edmon Sahakyan - Junior Investment Analyst
Disclaimer
This material is for professional investors and general information purposes only. It reflects ROQ Capital's assessment as of 2 October 2026 and may change without notice. It does not constitute investment advice, an offer or a solicitation to buy or sell any financial instrument, and does not take into account individual objectives or circumstances. All investments involve risk, including the possible loss of principal; past performance is not a reliable indicator of future results. Full terms are in the downloadable report.